Figure 1.
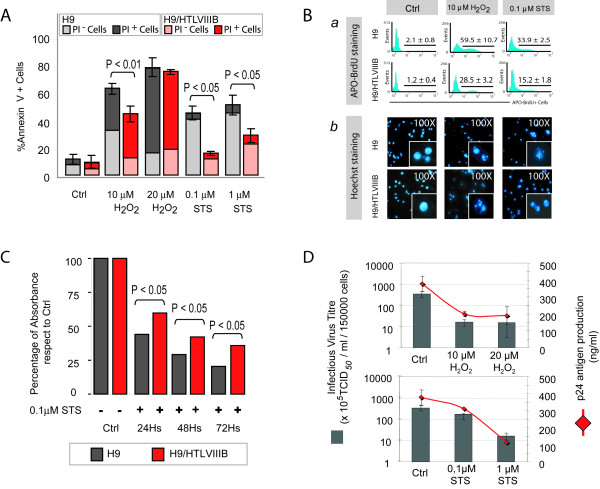
Apoptosis resistance in HIV persistently-infected H9/HTLVIIIBcells in comparison with non-infected H9 cells. A) H9 and H9/HTLVIIIB cells were treated with different concentrations of H2O2 or STS or complete medium as control. After 24 h, cells were harvested and annexin-V/PI staining was performed. The percentages of annexin-V+, PI- or PI+ cells are shown. B) (a) Analysis by APO-BrdU labeling by flow cytometry. The corresponding histograms and the percentages of APO-BrdU+ cells are shown; (b) Analysis of apoptosis with Hoechst 33324 by fluorescence microscopy. Micrographs (100×) of predominant Hoechst stained nuclei are depicted. C) H9 and H9/HTLVIIIB cells were treated with 0.1 μM STS or complete medium as control, and cells were harvested 24, 48 and 72 h post-treatment. Cell viabillity was analyzed by the MTT assay. Absorbances from treated samples were normalized to 100% of untreated controls. D) Cells treated with H2O2 or STS or complete medium for 24 h were pelleted and the supernatants were used to quantify infective viral (grey bar) and p24 antigen (red line) production.

