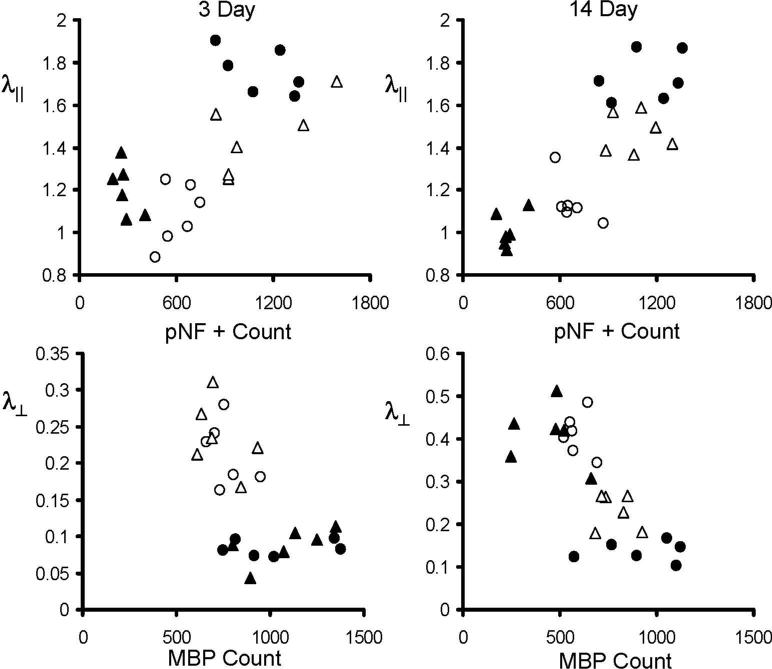
Figure 9.
The scatter plots of λ∥ vs. pNF positive count and λ⊥ vs. MBP positive counts from left (circles) and right (triangles) ON (filled symbols) and OT (opened symbols) at 3 and 14 days. At 3 days, λ∥ was significantly correlated with pNF positive counts with correlation coefficient (γ) of 0.83 and 0.84 for ON and OT respectively (p < 0.05). At 14 days, the γ between λ∥ and pNF positive counts were 0.94 and 0.67 for ON and OT respecively (p < 0.05), while the γ between λ⊥ vs. MBP positive counts were −0.78 and −0.77 for ON and OT respectively (p < 0.05). The unit for λ∥ and λ⊥ is μm2/ms.

