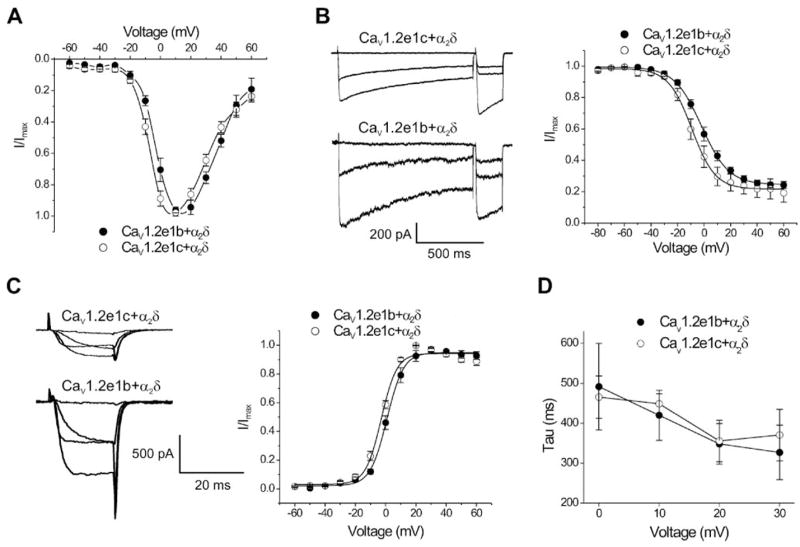
FIGURE 4. Current-voltage (I-V) relationships of CaV1.2e1b and CaV1.2e1c channels when expressed with auxiliary subunits.

Ba2+ currents were normalized to facilitate comparison. A, I-V relationships of CaV1.2e1b and CaV1.2e1c when co-expressed with α2δ. B, steady-state inactivation of CaV1.2e1c and CaV1.2e1b currents when co-expressed with α2δ. Exemplar current traces of 1-s conditioning depolarizing pulses evoked at −80, +10, and +30 mV followed by 200-ms test pulses to 0 mV (left panel). Cell capacitances for original recordings were: CaV1.2e1c + α2δ, 90 pF; CaV1.2e1b + α2δ, 66 pF. Mean steady-state inactivation fit with a Boltzmann function (right panel). C, voltage-dependent activation of CaV1.2e1c and CaV1.2e1b currents when co-expressed with α2δ. Exemplar tail currents evoked by repolarization to −80 mV after depolarizing test pulses to −20, 0, 20, and 40 mV (left panel). Cell capacitances for original recordings were: CaV1.2e1c + α2δ, 98 pF; CaV1.2e1b + α2δ, 66 pF. Mean voltage-dependent current activation (right panel). D, inactivation of CaV1.2e1b/α2δ and CaV1.2e1c/α2δ currents were best fit with a single exponential function. Tau was similar for CaV1.2e1b/α2δ and CaV1.2e1c/α2δ currents.
