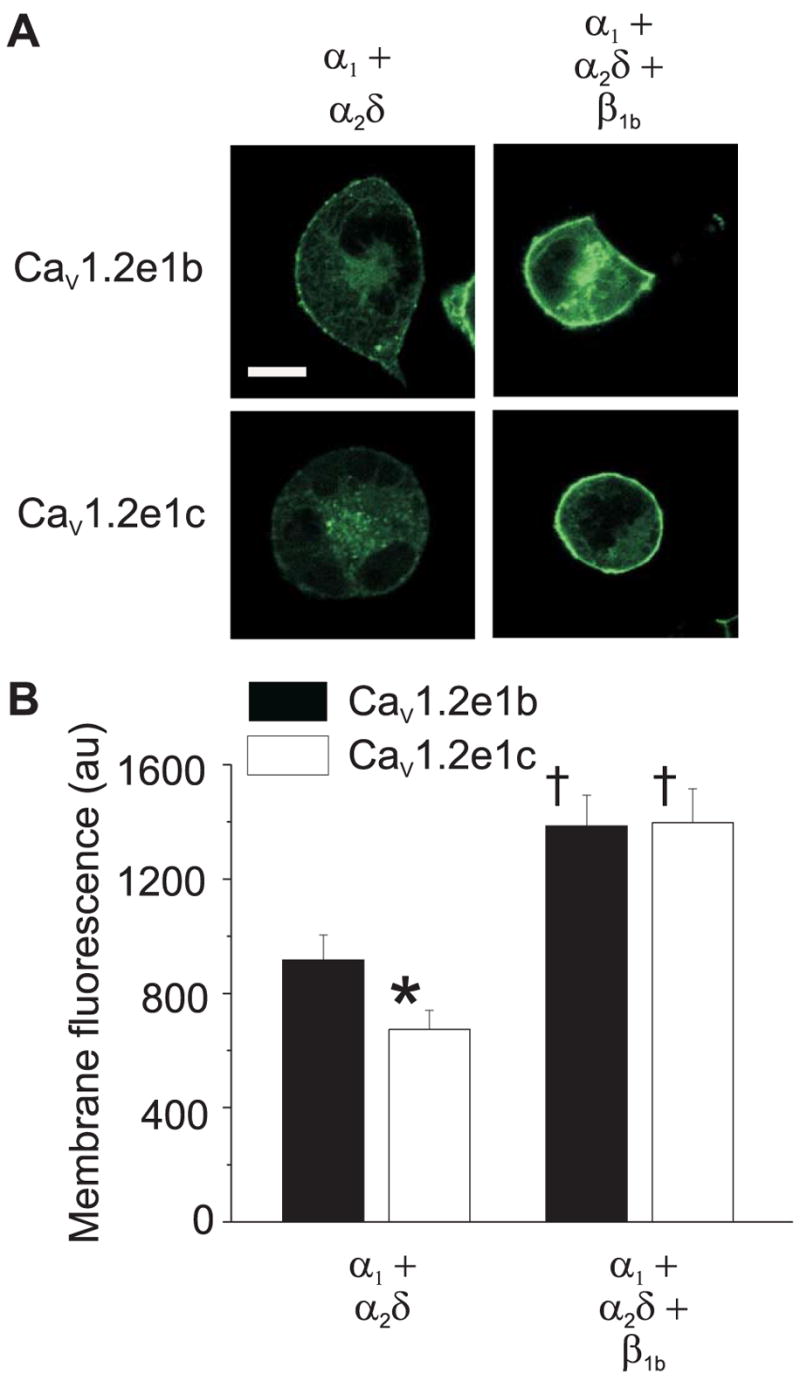
FIGURE 7. Membrane localization of EGFP-tagged CaV1.2e1b and CaV1.2e1c channels when expressed with α2δ or with α2δ + β1b subunits in HEK 293 cells.

A, representative images illustrating cellular fluorescence from EGFP-tagged CaV1.2e1b and CaV1.2e1c channels when expressed with subunit combinations indicated. Scale bar, 10 μm. B, mean data illustrating that co-expression of α2δ subunits elevated localized membrane fluorescence intensity of CaV1.2e1b more than for CaV1.2e1c, and that co-expression with α2δ + β1b subunits further increased membrane fluorescence and normalized the difference between CaV1.2e1b/α2δ and CaV1.2e1c/α2δ. au indicates arbitrary units. Number of cells: CaV1.2e1b/α2δ, 18; CaV1.2e1c/α2δ, 16; CaV1.2e1b/α2δ/β1b, 17; CaV1.2e1c/α2δ/β1b, 20. * indicates p < 0.05 when compared with CaV1.2e1b + α2δ, and †, p < 0.05 when compared with the same α1 subunit + α2δ.
