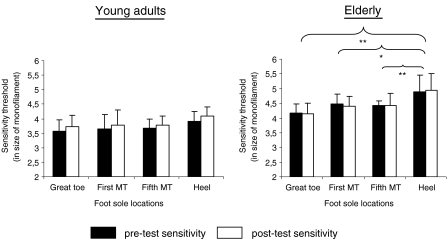
Fig. 5.
Changes of sensation between the pre-test and post-test sensitivity for the young adults and the elderly. Note that the threshold values are log-transformed: the 2.83, 3.61, 4.31, 4.56, 5.07 and 6.65 monofilaments correspond respectively to a pressure perception threshold of 0.1, 0.4, 2.1, 3.6, 11.7 and 446.7 g. The higher the size of the monofilament, the smaller the fine-touch sensitivity. The significant values are reported (*p < 0.05, **p < 0.01)

