
Figure 1.
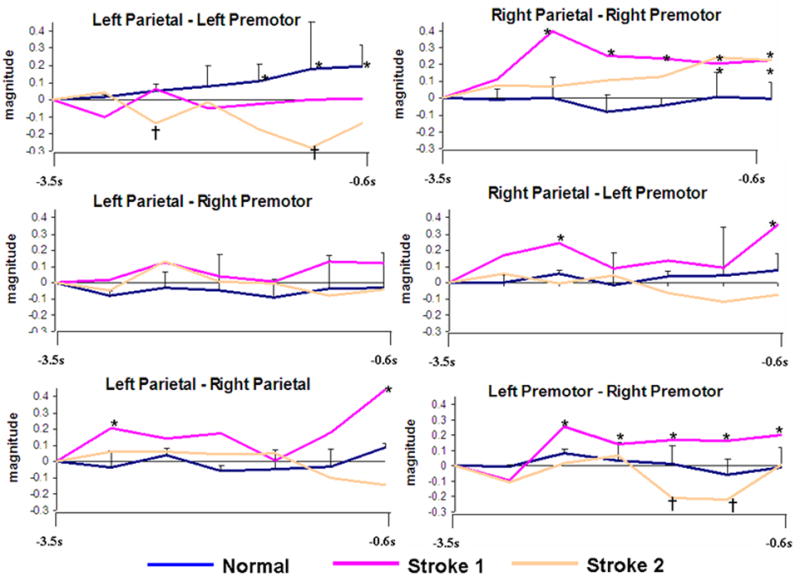
Time-magnitude plots of individual (stroke) and mean coherence (normal subjects) divided into each network of interest relative to movement onset (s). Standard error bars represent the distribution of normal subject coherence. Asterisks (*) indicate significant increases, † denotes significant decreases.