
Figure 2.
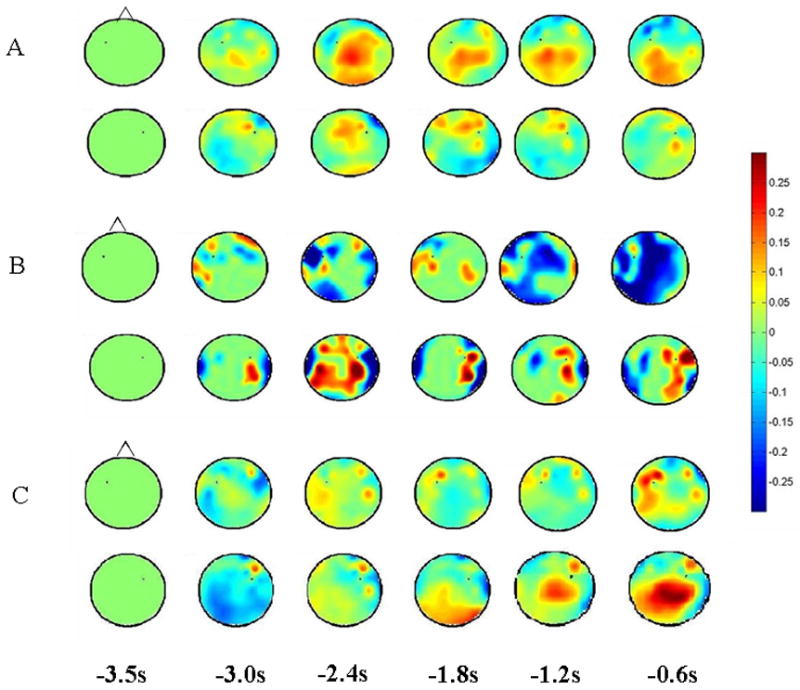
Head plots of coherence relative to left and right premotor cortex in normal subjects (A), stroke patient #2 (B) and CBD patient #3 (C). A, B, and C (top) shows coherence relative to the electrode over the left premotor cortex. A, B, and C (bottom) shows coherence relative to the electrode over the right premotor cortex. Time (s) is relative to EMG onset. Coherence increases are shown in red; decreases in blue.