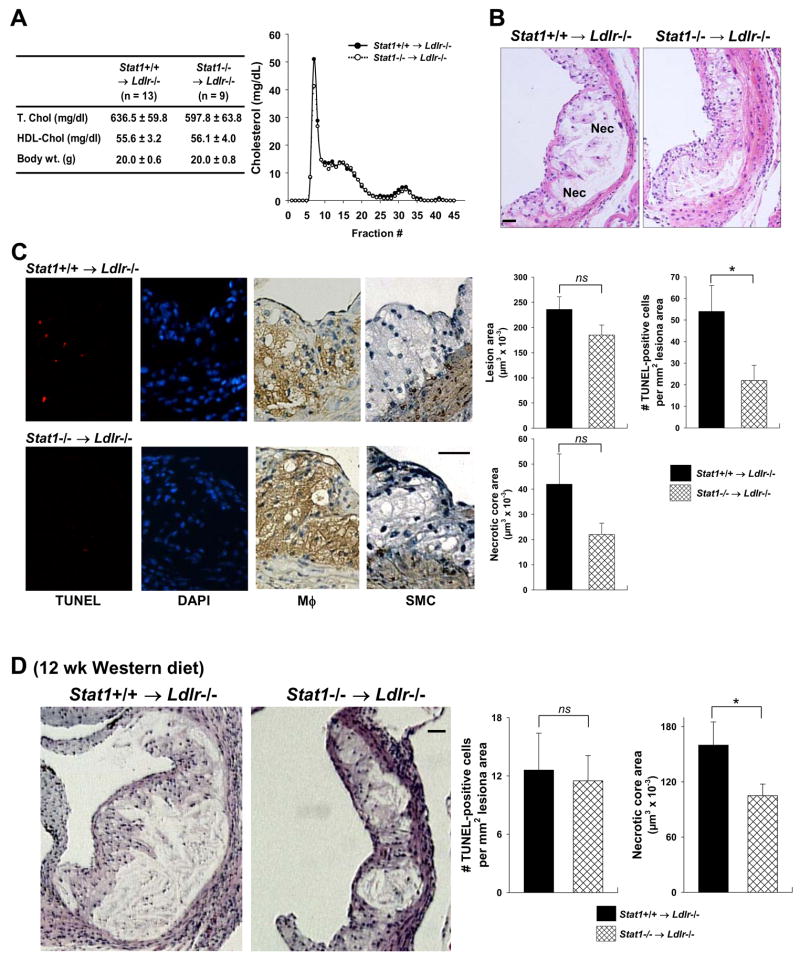
Figure 8.
STAT1 plays a role in advanced lesional macrophage apoptosis and plaque necrosis in female Stat1−/− →Ldlr −/− mice. (A) The table shows plasma cholesterol and body weight of Ldlr−/− mice transplanted with Stat1+/+ or Stat1/bone marrow and then fed a Western-type diet for 10 wks starting at 6 wks after transplantation. The graph shows pooled plasma samples from three Stat1+/+ and three Stat1−/− recipient mice that were fractionated by FPLC gel-filtration chromatography and then assayed for cholesterol. None of the differences in cholesterol, lipoproteins, or body weight were statistically significant. (B) Hematoxylin and eosin staining of proximal aortas from 10-wk Western diet-fed Ldlr−/− mice transplanted with bone marrow from Stat1+/+ and Stat1−/− mice. Bar, 20 μm. Nec = necrotic areas. (C) TUNEL (red), DAPI (blue), and macrophage (brown) staining of lesions similar to those in (B). Bar, 20 μm. The graph in panel C shows quantification of lesion area, TUNEL-positive cells, and necrotic area in the lesions of Stat1+/+ →Ldlr −/− and Stat1−/− →Ldlr −/− mice. *, p = 0.034 by Student’s t test. (D) Hematoxylin and eosin staining of proximal aortas from 12-wk Western diet-fed Ldlr−/− mice transplanted with bone marrow from Stat1+/+ and Stat1−/− mice (n = 18 for both groups of mice). Bar, 20 μm. The graph in panel D shows quantification of TUNEL-positive cells and necrotic area in the lesions of Stat1+/+ →Ldlr −/− and Stat1−/− →Ldlr −/− mice. Total lesion area was 493.7 ± 40.5 and 380.6 ± 24.4 μm2 in Stat1+/+ →Ldlr −/− and Stat1−/− → Ldlr−/− mice, respectively. *, p = 0.02 by Student’s t test.

