
Figure 3. TCRs on T cell hybridomas derived from expanded Treg blasts accurately represent TCRs found on Treg cells.
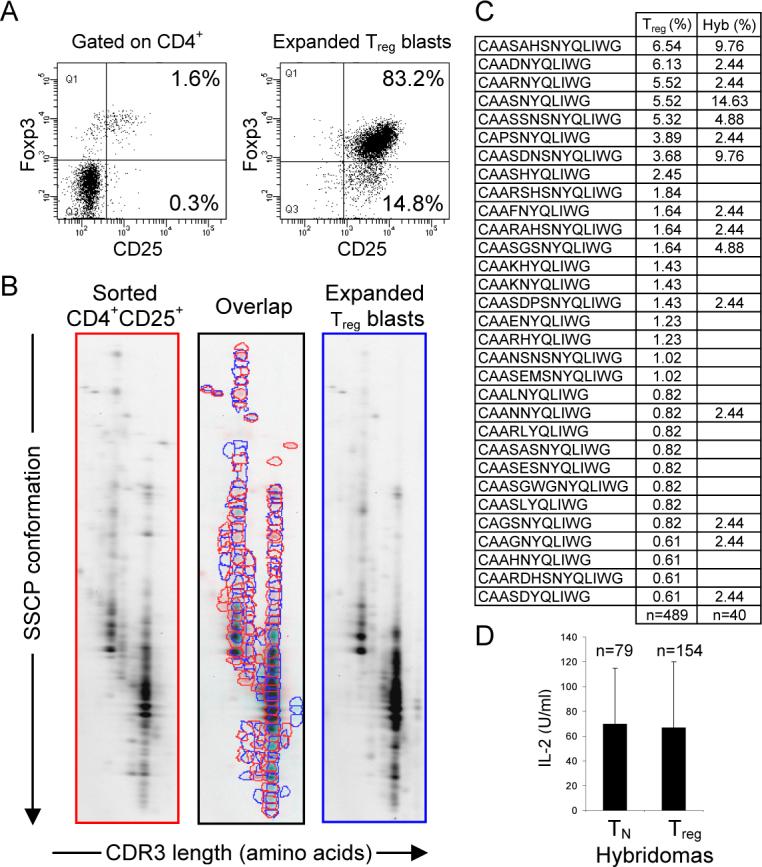
(A) Expression of Foxp3 by Treg cells isolated from lymph nodes of TCRminiEp mice and 7−10 days after in vitro culture of these cells. Cells were surface-stained with antibodies against CD4, CD8, and CD25 molecules, followed by intracellular staining with Foxp3 antibody. (B) 2D-F-SSCP revealed extensive (82%) overlap of CDR3 regions of TCRα chains from freshly sorted and expanded Treg cells. cDNA was synthesized from isolated RNA of both types of cells. Run-off PCR was done with primer specific for TCRVα2, coupled with Cy3 (fluorescent dye). First, fluorescent PCR products were run in the first dimension using capillary electrophoresis in denaturing PAGE. The second dimension was run in a non-denaturing SSCP slab gel. Resulting 2D gels show diversity, distribution, and frequency of dominant CDR3α regions from indicated populations. The intensity of individual dots corresponds to the real frequency of a particular rearrangement in the original sample. Spots migrating with different speed on the second dimension SSCP gel represent different VαJα rearrangements. (C) TCR CDR3α sequences retrieved from Treg-derived hybridomas (Hyb) were compared with the most abundant CDR3α sequences found in Treg cells in TCRminiEp mice (Treg). (D) Hybridomas derived from naïve T or Treg cells of TCRminiEp mice, were co-cultured with splenocytes from C57BL/6 mice. Responding hybridomas were compared for the ability to produce IL-2. Production of IL-2 secreted by activated hybridomas was measured by HT-2 proliferation using MTT assay. Results are shown as arithmetical mean ± SD.