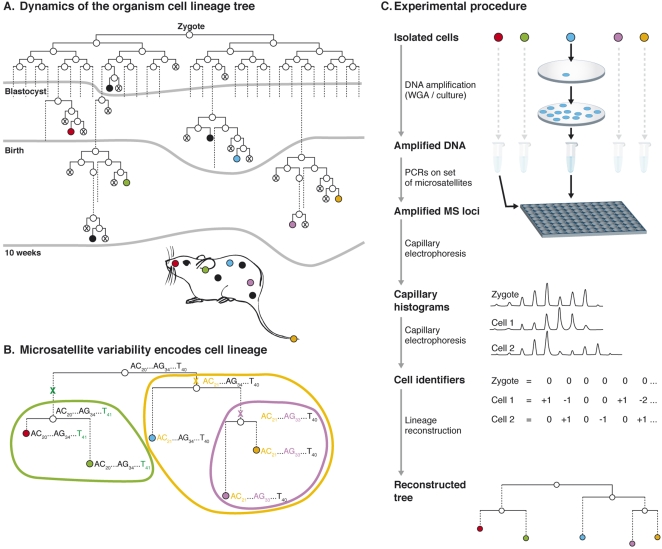
Figure 1. Cell lineage analysis based on somatic MS mutations.
A. The cell lineage tree of an organism is a rooted labeled binary tree representing its development from a single cell until present time. Nodes (circles) represent cells (dead cells are crossed), and edges (lines) connect parent and daughter cells (dashed lines represent several divisions). Uncrossed leaves (nodes with no daughters) represent extant cells. Lineage trees are a snapshot of a specific timepoint, which constantly grow throughout embryonic development and the adult life of the organism. Any cell sample (colored leaves) induces a partial subtree, called the cell sample lineage tree (panel B). B. The genomic composition of cells in the sample tree at three MS loci is shown. Spontaneous somatic mutations (marked by X) in these loci are sufficient to encode the lineage relations between these cells. Cells that are genetically similar tend to share a longer common developmental path, consequently enabling phylogenetic analysis to reconstruct the tree. Although idealized mutations are depicted, even potential hampering factors (such as coincident mutations) are not expected to disrupt analysis if a sufficient number of loci are analyzed [1]. C. Scheme of reconstruction procedure. DNA from isolated cells is amplified either by culture or whole genome amplification, after which each cell is analyzed over a large set of MS loci using PCR and capillary electrophoresis. Capillary histograms are automatically analyzed yielding cell identifiers, which represent the mutations each cell accumulated in the MS set. Phylogenetic analysis of cell identifiers yields a reconstructed tree, which is an estimation of the lineage relations between analyzed cells.

