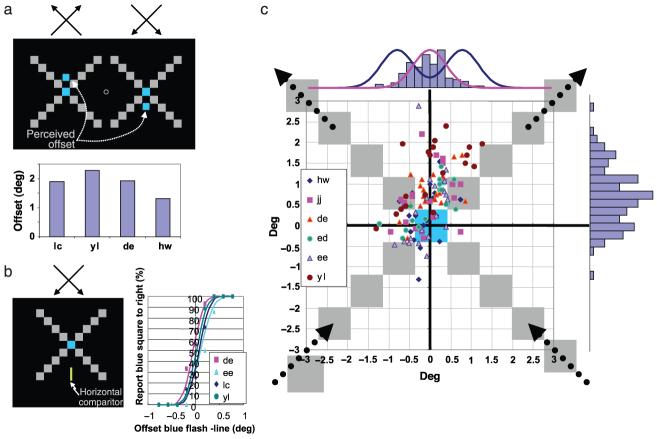
Figure 5.
Localization of the feature-flashed moving object is biased by the sum of motion vectors. Stimulus: two gray boxes, 0.8° on a side, followed perpendicular trajectories. Each box occupied nine successive screen positions and remained in each position for 40 ms, for a total path of 7.2° over 360 ms. (a) Two X-shaped trajectories were compared with each other on opposite sides of fixation: one with both squares moving up and the other with both squares moving down. Direction of trajectories and offset between the center points were randomized. Offset was measured as half the shift indicated by the psychometric functions. All observers verbally reported seeing only one blue square; 120 trials, n = 4. (b) To indicate whether the blue square was being perceived along one trajectory or the other, observers indicated whether the blue square was to the left or to the right of a comparator line placed randomly in a horizontal range of ±1°; 80 trials, n = 4. (c) Observers clicked the computer mouse at the location on the screen where they perceived the center of the blue flash. The mouse pointer was invisible until the stimulus display ended. The X-shaped trajectory was randomly displaced ±5° horizontally and vertically from the screen center on each trial, and the direction of the paired trajectories (up or down) was randomized; 20 trials per subject, in a dark room with no fixation point. The slight upward-right and downward-left bias is unexplained but may relate to subject handedness or the tilt of the mouse arrow. Histograms on the right and top show the distribution of perceived positions. If the blue were assigned to a real position of the square or even to an interpolated position, the histogram on top would be double-humped (blue). Instead, the distribution best matched a Gaussian centered at zero (magenta).

