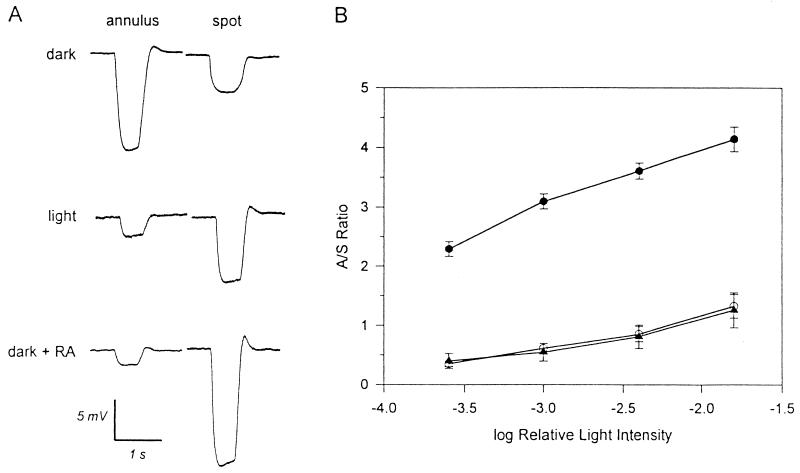
Figure 5.
Effects of at-RA on the spatial properties of the light responses of H1 horizontal cells. (A) Light responses to annular and centered spot stimulation at an intensity of log −3 under the indicated conditions. (B) Plot of the annulus/spot ratio against light intensity. Solid circles represent the data obtained from a dark-adapted retina, and open circles represent data from a light-adapted retina. Solid triangles represent the data obtained from a dark-adapted retina superfused with at-RA.

