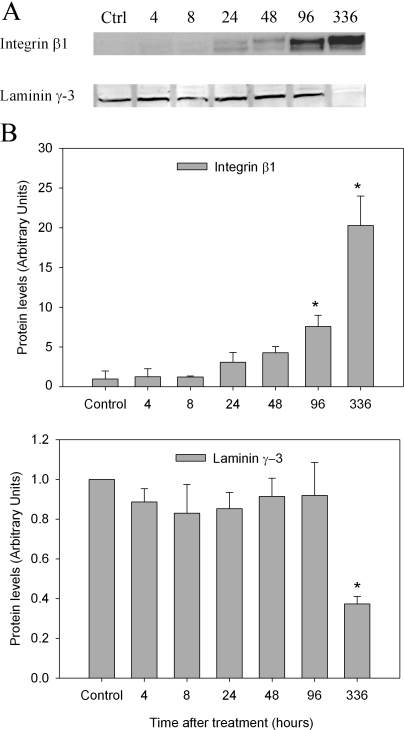
Figure 8.
Western analysis for integrin-β1 and γ-laminin. A, Testicular proteins (100 μg) in lysates were analyzed for integrin-β1 and γ-laminin by Western blotting. B, The immunoblots were densitometrically scanned for the protein levels of integrin and laminin. The levels of integrin-β1 (top panel) and γ-laminin (bottom panel) in control (Ctrl) rats were arbitrarily set at 1.0. Each bar is the mean ± se of data from four blots (four rats per time point). *, P < 0.05.

