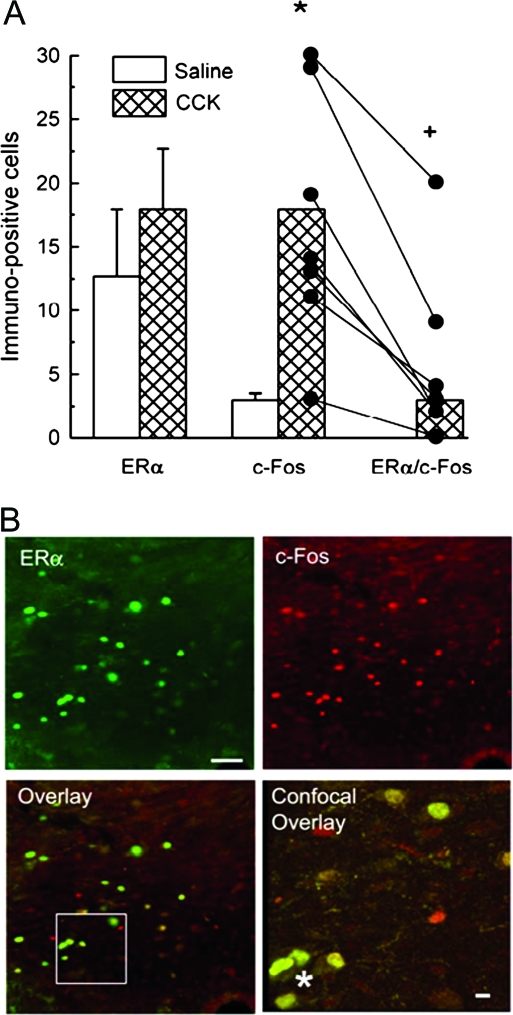
Figure 5.
CCK activates cNTS ERα-positive cells in rats that received open-surgical hindbrain implants of 0.2 μg EB (H-EB). A, Numbers of single-labeled ERα-positive cells (left columns), single-labeled c-Fos-positive cells (middle columns), and double-labeled ERα/c-Fos-positive cells (right columns). Note all ERα/c-Fos values in saline-injected rats were 90 min after ip injection of saline or 4 μg/kg CCK-8 (CCK), visualized with immunofluorescence staining. In left and middle columns, data are mean ± sem numbers of ERα- or c-Fos-positive cells per section; in right columns, data are median number of ERα/c-Fos-positive cells per section; individual c-Fos single-labeling and ERα/c-Fos double-labeling data are shown in the middle and right CCK columns, with lines connecting each rat’s data. *, Number of c-Fos-positive cells different in saline- and CCK-injected rats (P < 0.05). +, Number of ERα/c-Fos-positive cells different in saline- and CCK-injected rats (P < 0.05). B, Optical micrographs of a 40-μm cNTS section showing immunofluorescence staining of ERα single labeling, c-Fos single labeling, and ERα/c-Fos double labeling (overlay) and a 1-μm confocal micrograph of ERα/c-Fos double labeling in area indicated by white box in overlay (confocal overlay). Asterisks indicate representative double-labeled cells. Scale bars, 60 μm in optical micrographs and 10 μm in confocal micrograph.

