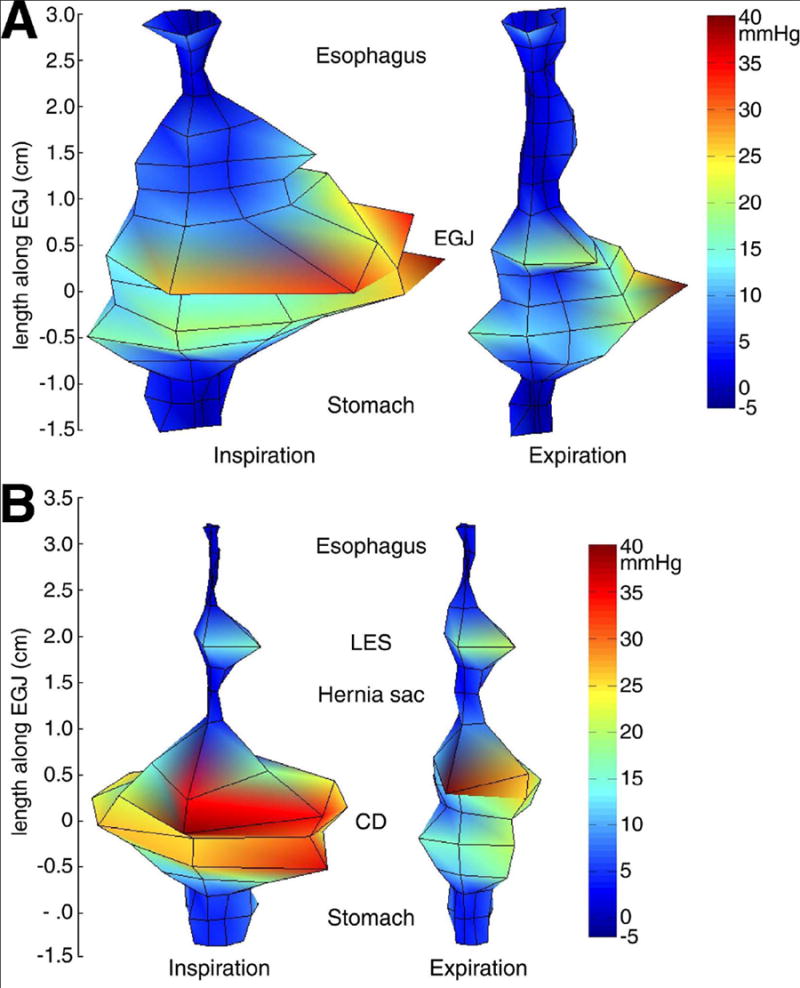
Figure 4.

High definition recordings of the EGJ in a normal individual (A) and a patient with a 2 cm separation between the lower esophageal sphincter (LES) and the crural diaphragm (CD). Pressure is scaled both by color and deflection from the central axis with the deepest blue being -5 mmHg relative to atmospheric pressure and red being 40 mmHg. For reasons of illustration, the quadrilateral sector of pressure contributed by each sensor is delineated by black lines on the surface of the solid. Although only the instants of peak inspiration and expiration are illustrated, pressures are acquired in real time and can also be displayed as movies.
