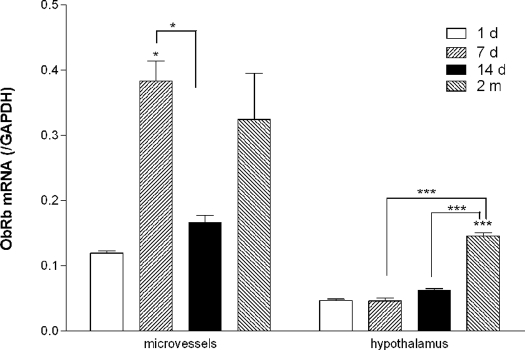
Figure 10.
Dynamic changes in ObRb expression shown by TaqMan real-time PCR. Cerebral microvascular ObRb mRNA was highest at d 7 and increased again at 2 months. Hypothalamic ObRb was highest in the adults. Asterisks above the bar indicate comparison with 1-d-old group. Asterisks connected by a line indicate comparison between other groups. *, P < 0.05; ***, P < 0.005 (n = 2 for the 1-d group; n = 4 for the rest).

