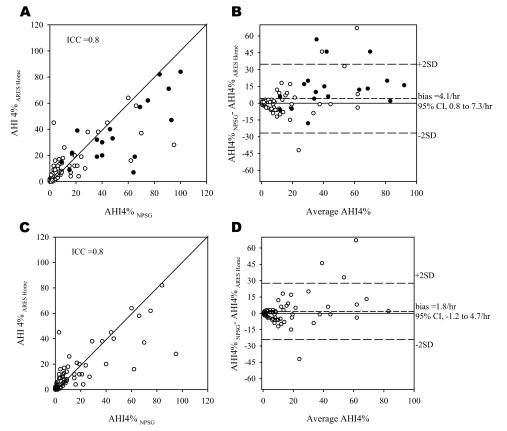
Figure 4.
A—Relationship between apnea-hypopnea index (AHI) derived from the nocturnal polysomnogram (AHI4%NPSG) conducted in the lab and the AHI based on the Apnea Risk Evaluation System (ARES™) studies conducted in the home. Each point represents 1 subject. As in figure 2, the closed circles represent studies with less than 3 hours of recording time. B: Bland Altman plot showing the difference between the AHI4% (nocturnal polysomnogram-ARES Home) plotted against the average of the 2 AHI4%s. Panels C and D: Relationship between AHI4%NPSG and AHI4%ARES Home excluding data from the split-night studies. 95%CI refers to 95% confidence interval.

