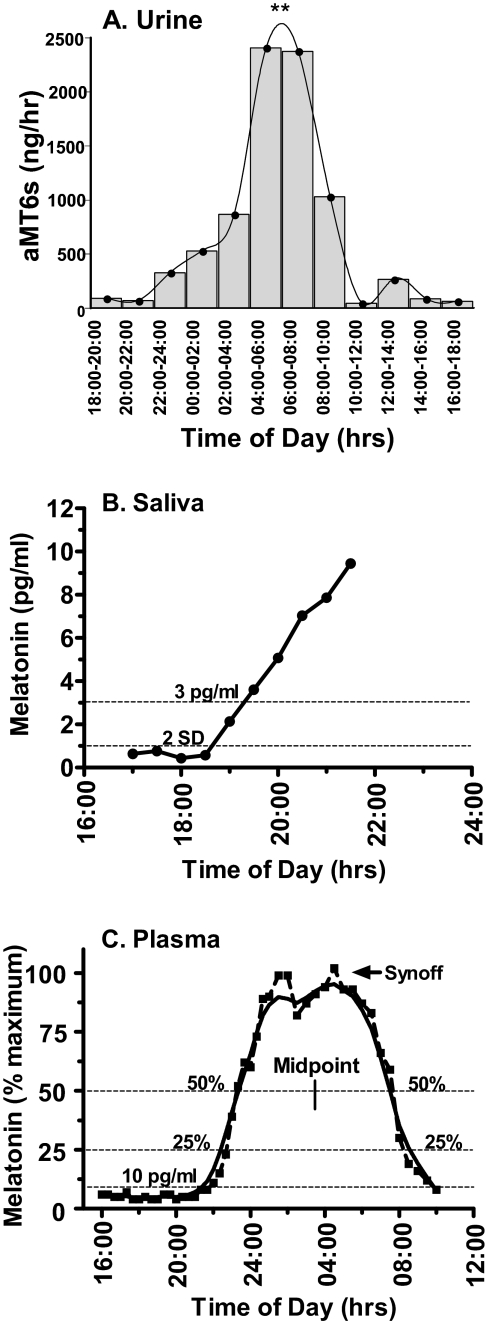
Figure 1.
Illustrations of 3 melatonin sample types and their associated phase estimates. (A) 24-hour rhythm of the primary urinary melatonin metabolite 6-sulphatoxymelatonin (aMT6s) derived from urine samples collected in 2-h bins under dim light. The fitted curve reveals a significant 24-hour rhythm with maximum levels observed between 04:00 and 08:00 (**p < 0.01). (B) Salivary melatonin profile collected under dim-light conditions. The low-threshold dim-light melatonin onset (DLMO) was defined as either the first sample to exceed and remain above a threshold of 3 pg/mL or that was 2 SD above the mean of the first 3 baseline samples (2 SD). (C) Overnight plasma melatonin profile, plotted as a percentage of maximum (dashed line) and smoothed with a Lowess curve fit to the raw data (solid line). Some frequently used phase markers are shown: DLMO at 10 pg/mL, DLMO or dim-light melatonin offset (DLMOff) at 25% or 50% of maximum levels, the midpoint, and the termination of melatonin synthesis (Synoff).

