
Fig. 4.
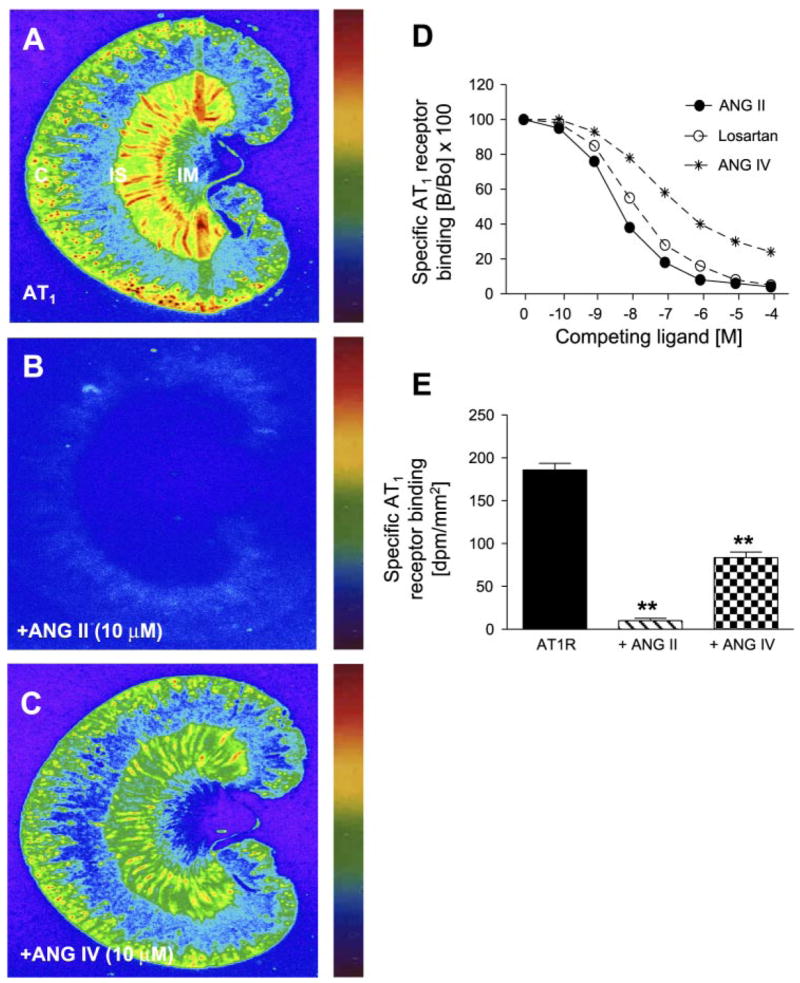
Autoradiographs showing the effects of unlabeled ANG II or IV on specific AT1 receptor binding in the rat kidney. A: AT1 receptor binding. B: AT1 receptor binding was completely displaced by unlabeled ANG II (10 μM). C: AT1 receptor binding was partially inhibited by unlabeled ANG IV (10 μM). D: concentration-dependent inhibition of AT1 receptor binding by increasing concentrations of unlabeled ANG II, ANG IV, and losartan (10−10 to 10−4 M). E: quantitative levels of AT1 receptor (R) binding in the absence and presence of unlabeled ANG II or ANG IV. Color bars: red represents the highest level of binding, whereas blue shows the background level. **P < 0.01 vs. total AT1 receptor binding in the absence of unlabeled ANG II or ANG IV (10 μM). C, cortex; IS, inner stripe of the outer medulla; IM, inner medulla.