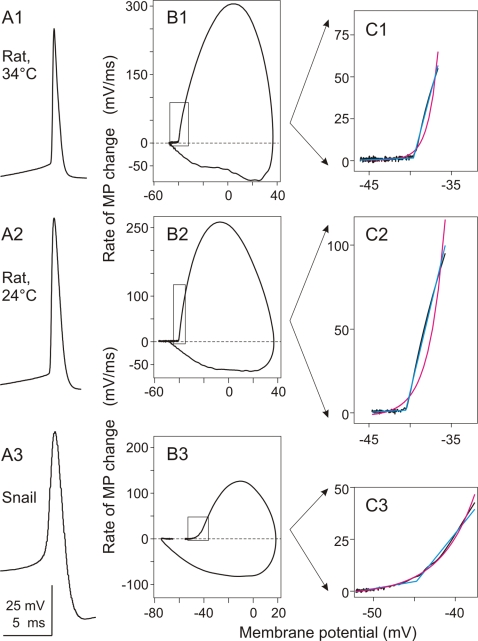
Figure 1. Action potentials recorded in neurons in rat neocortex (A1–C1 and A2–C2) and in snail neuron (A3–C3) have different onset dynamics.
A: Waveform of the action potentials recorded in two rat neocortical neurons at 34°C (A1) or 24°C (A2) and in a small cerebral neuron (20 µm soma diameter) in snail (A3). B: Phase plot representation of the APs from A. C: Close-up of the initial portion of the phase plots indicated with boxes in B. Magenta lines show exponential fits, Cyan lines piecewise linear fits to the data. Ratio of errors of exponential fit over the piecewise-linear fit were 8.22 in C1, 12.3 in C2 and 0.55 in C3. Note different onset dynamics of the APs: rapid, step-like in rat neurons, but slow, exponential-like in the snail neuron.

