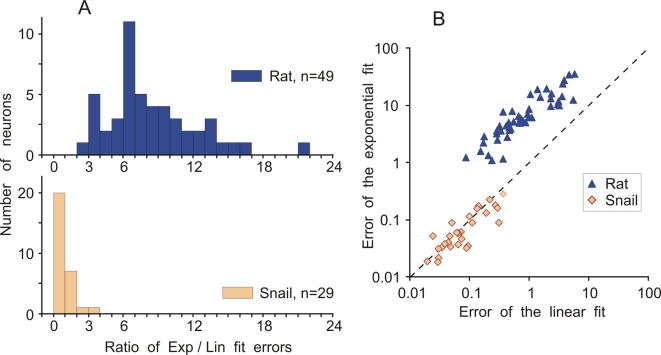
Figure 2. Population analysis: Ratio of the errors of exponential fit over the piecewise-linear fit for rat and snail neurons.
A: Distributions of the ratio of errors of the exponential fit and piecewise-linear fit of the initial part of APs for 49 rat neocortical neurons and 29 snail neurons. B: Scatter plot of the error of exponential fit against the error of the piecewise linear fit for the neurons from A. Notice double-logarithmic scale. Each point represents data for one neuron. Colour code is the same in A,B.

