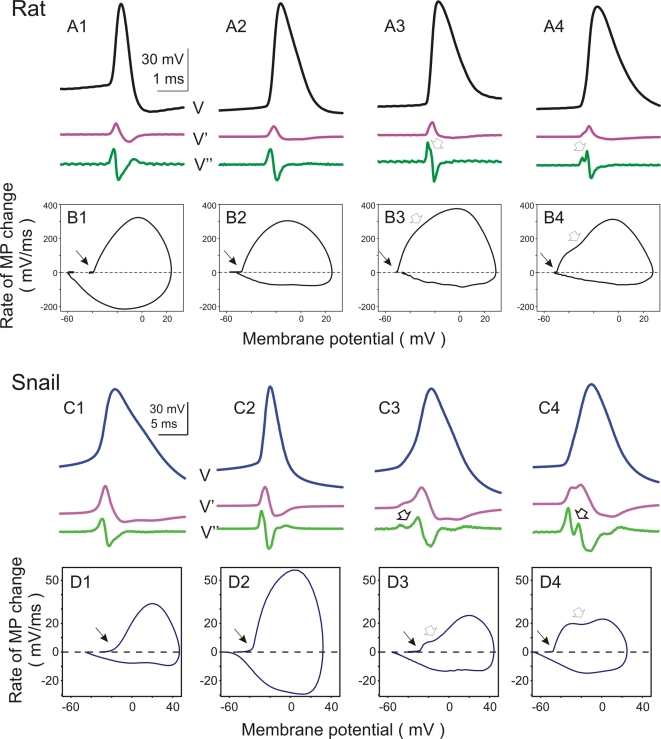
Figure 3. Action potentials in either rat and snail neurons have different waveforms.
A, B: Action potentials recorded in 4 different neurons from rat neocortex. In A, voltage traces (V) are shown together with their first (V') and second (V”) derivatives. In B, phase plots of action potentials from A are shown. Ratio of errors of exponential fit over the piecewise-linear fit for these neurons were: 7.27; 6.07; 6.95; 3.46. C, D: Action potentials recorded in 4 identified snail neurons and their phase plots. Recordings from visceral ganglion neuron Visc5 (C1,D1); Left pedal ganglion neuron LPd2 (C2,D2); Right cerebral serotonergic neuron RC5HT (C3,D3) and Left pedal ganglion neuron LPd7 (C4,D4). Notice 8-fold difference in the Y-scale between B and D. In A–D open arrows indicate double-peak on the second derivative trace and bimodal shape of the phase plots. For both rat and snail neurons, the APs are sorted from left to the right by the increasing strength of manifestation of the double-peak on the second derivative trace and bimodal shape of the phase plots (open arrows). Ratio of errors of exponential fit over the piecewise-linear fit for 1–4 were: 0.79; 0.70; 0.92; 3.14. Notice that all APs in rat neocortex neurons have a sharp onset, irrespective of the presence and expression of the double peak in the phase plots.

