
Fig. 1.
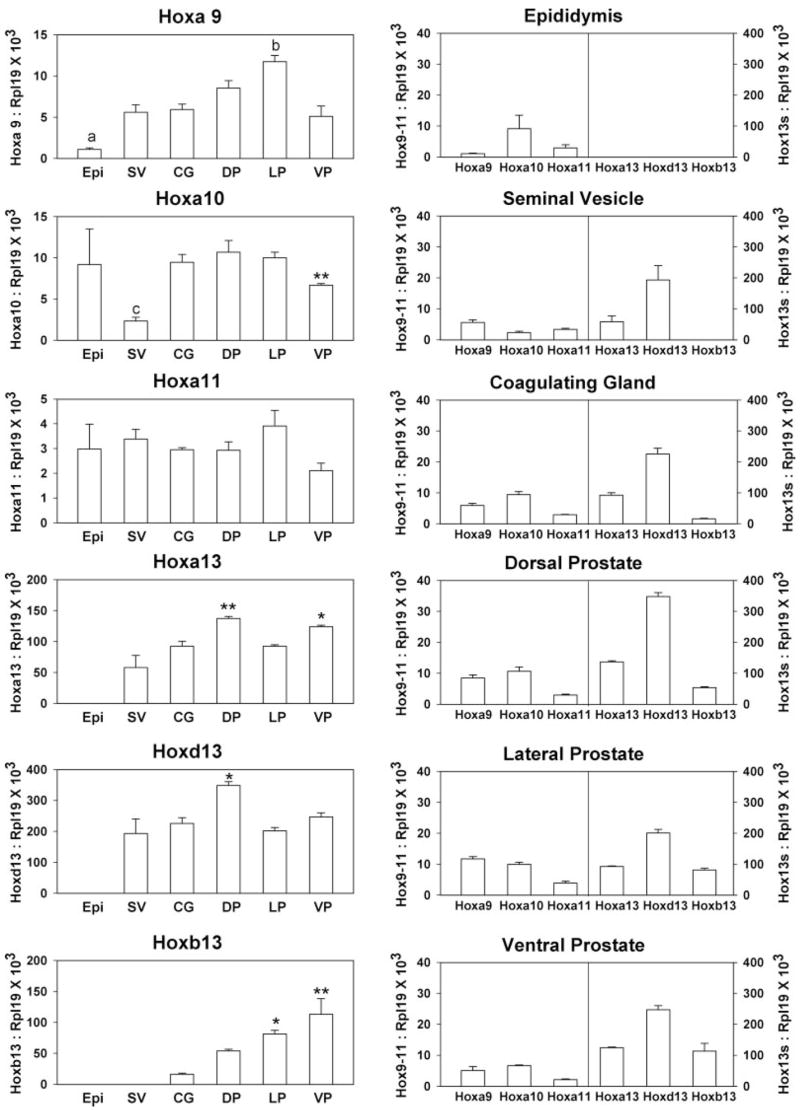
Quantitation of posterior Hox gene expression in the adult male accessory sex glands. Real-time RT-PCR was used to measure Hoxa9, Hoxa10, Hoxa11, Hoxa13, Hoxd13, and Hoxb13 mRNA levels in d 90 intact rat epididymis (Epi), seminal vesicle (SV), coagulating gland (CG), DP, LP, and VP. Bars represent mean ± sem for three to 11 replicates. The left column shows expression levels for each individual Hox gene within the different structures along the anterior-to-posterior axis. Hoxb13 is noted for the most striking colinear gradient along the anterior-to-posterior axis. Significance levels for each genes are: Hoxa9, a, P < 0.001 vs. DP and LP; b, P < 0.01 vs. SV, CG, and VP; Hoxa10, c, P < 0.05 vs. all groups, **, P < 0.01 vs. LP; Hoxa11, no significant differences; Hoxa13, *, P < 0.05; **, P < 0.01 vs. SV; Hoxd13; *, P < 0.05 vs. SV and LP; Hoxb13, *, P < 0.05; **, P < 0.01 vs. CG. The right column shows the posterior Hox code for each individual male accessory sex gland. The combination of Hox genes differs among the various structures, constituting a unique Hox code for each tissue. Notably, the anterior boundary for all Hox13 genes is at the epididymis, which does not express any Hox13 paralog. Although Hoxa13 and Hoxd13 are expressed in the seminal vesicles, Hoxb13 expression is restricted to UGS-derived structures. The most anterior of the prostate lobes, the DP, has the highest expression levels of Hoxa13 and Hoxd13 but low Hoxb13 expression. The LP has the lowest expression of Hoxa13 and Hoxb13 and moderate Hoxd13 levels. The posterior VP is distinct from the other two lobes with the highest expression of Hoxb13 mRNA and the lowest levels of the anterior Hoxa9, Hoxa10, and Hoxa11 genes.