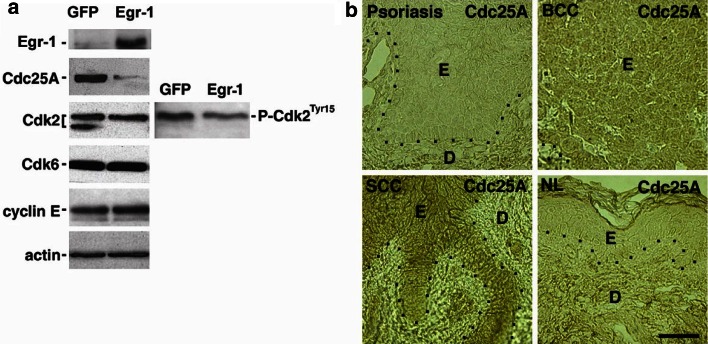
Fig. 4.
Expression of selected G1 phase cell cycle regulators as a function of Egr-1. (a) Protein extracts were prepared 36 h after high efficiency retroviral transduction. Note the decrease in Cdc25A with Egr-1 expression. Note also the decrease in the lower Cdk2 band which represents the phosphorylated less active form as confirmed in the right Cdk2 panel using antibody specific for Cdk2Tyr15. (b) Cdc25A expression in hyperproliferative skin disorders. Note increased expression in BCC and SCC and lack of increase in psoriasis compared to normal skin (NL). E = epidermis, D = dermis, dotted line = basement membrane zone. Scale bar = 100 μm

