
Fig. 1.
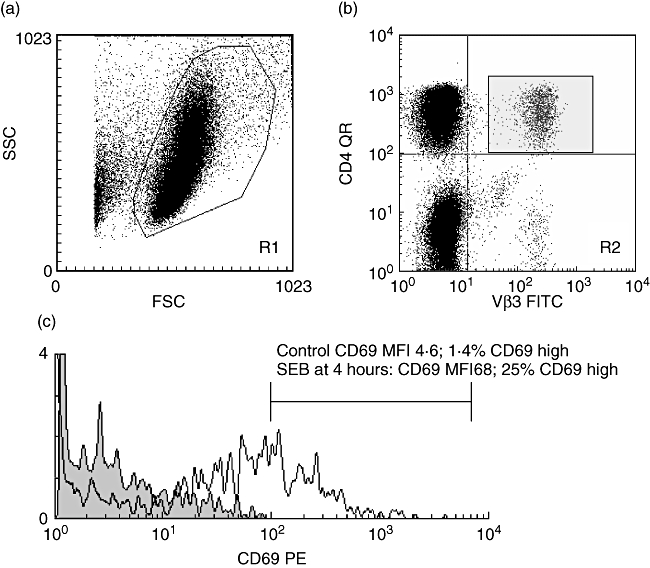
Flow cytometric protocol for the assessment of Vβ restricted CD 69 expression. (a) A forward- (FSC) and side-scatter (SSC) plot was used to define the lymphocyte gate (checked by back-gating on CD3; data not shown) region 1 (R1). (b) A dot-plot gated on R1 was then used to plot CD4 or CD8 against Vβ 1, 2, 3, 5·1, 8 or 12 (data for CD4 Vβ3 only shown). Region 2 (R2, in this example CD4 Vβ3) was then gated and a histogram plotted (c) gated on R1 and R2 of CD69 expression. In this experiment, the CD4Vβ3 response to 4 h incubation in vitro with the superantigen Staphylococcal enterotoxin B (100 ng/ml) resulted in an increase in CD69 expression from a median fluorescence index (MFI) of 4·6 (grey fill) to an MFI of 68 (or a percentage increase in CD69 high cells of 1·4% to 25%). Using this flow cytometric approach it was thus possible to derive both the percentage of each Vβ family within the CD4 or CD8 T cell subpopulation, and the CD69 expression across the CD4 and Cd8 Vβ repertoire. Abbreviations: QR, quantum red; PE, phycoerythrin; FITC, fluorescein isothiocyanate.