
Fig. 2.
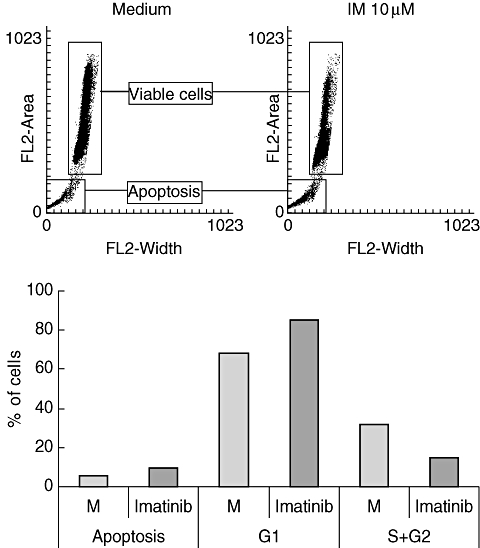
Influence of imatinib (IM) on cell cycle progression. Isolated T cells were stimulated with phorbol myristate acetate/ionomycin as described in Fig. 1. Cell cycle progression was assessed by propidium iodide and analysed by fluorescence activated cell sorter analysis. Results of a representative experiment (n = 3) are depicted as histogram (a). In (b) results are expressed as mean percentage of apoptotic cells or as mean percentage of cells in the G1 or S + G2 phase.