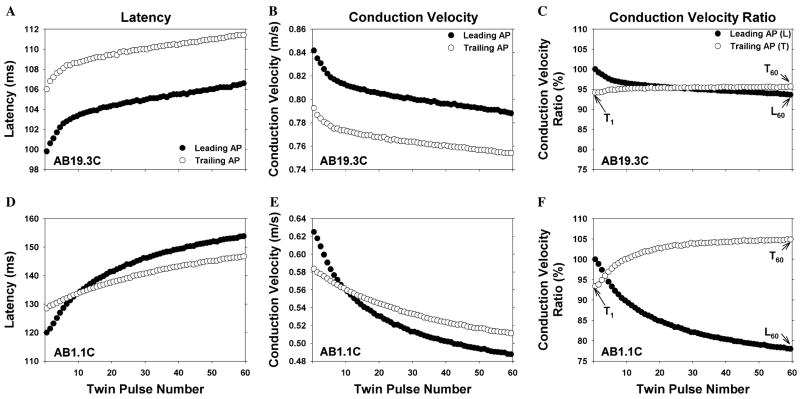
Fig. 2.
Changes in conduction velocity during repeated electrical stimulation. Each row corresponds to a different C fiber. The left column is a plot of action potential latency as a function of twin pulse number, the middle column is the same data converted to conduction velocity, and the right column is the same data normalized by the conduction velocity of the first action potential (see text for normalization procedure). The data obtained from the leading action potential (filled circle) and trailing action potential (open circle) for the twin pulse stimulus are plotted separately. For each fiber, the conduction velocity decreased during the stimulus train, but the degree of this activity-dependent slowing varied (note the different scales for each fiber). In addition, the pattern of changes in the conduction velocity for the trailing AP relative to the leading AP was different for each of these fibers. For comparison across fibers, the three values illustrated in C were computed for each fiber. L60 is the conduction velocity of the last leading AP divided by the conduction velocity of first leading AP. T1 is the conduction velocity of the first trailing AP divided by the conduction velocity of first leading AP. T60 is the conduction velocity of the last trailing AP divided by the conduction velocity of the last leading AP.

