
Figure 3.
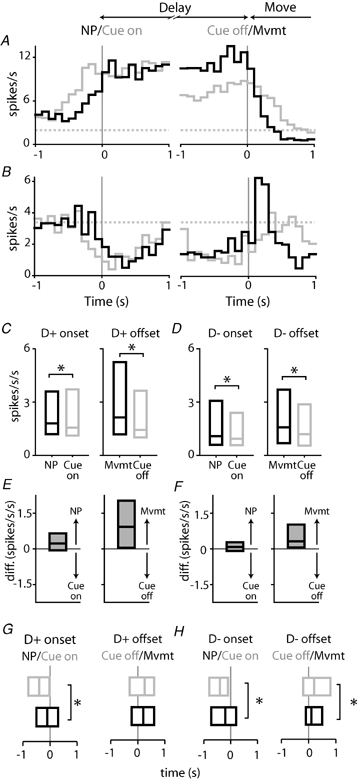
Changes in firing rate occurring near delay onset and offset are closely tied to movement, rather than the instructive cue A, a single example neuron, showing perievent histograms constructed around onset responses (left panel) occurring at nosepoke (NP: black line) and cue delivery (Cue on: grey line); and offset responses (right panel) occurring at movement onset (Mvmt: black line; identical with delay termination) and cue termination (Cue off: grey line). For this neuron, the excitatory response occurring near delay onset (left panel) was similar for nosepoke and cue onset. However, the excitatory response preceded cue onset, indicating that firing was not driven by cue delivery. The offset of this D+ firing pattern is more closely associated with movement onset than cue offset; the rate of change in firing is larger and more rapid in the histogram constructed around movement. B, onset and offset histograms for a D− M+ neuron. Conventions are identical to those described in A above. Note that the change in the rate of firing at delay offset (right panel) in this neuron was large, relative to delay onset; and that the offset response was more closely associated with movement onset than cue offset. These patterns were typical of the entire population of neurons. C, absolute rate of change in firing for the population of D+ onset (left panel) and offset (right panel) responses. Box plots depict median and 1st and 3rd quartile values. For onset responses, changes in firing occurring at nosepoke onset were larger than those occurring at cue onset (P < 0.05, Wilcoxon's signed rank test). Similarly, offset responses were larger at the time of movement initiation relative to cue offset (P < 0.05). All units are in spikes s−2. D, average absolute rate of change in firing D− onset and offset responses. Figure conventions are identical to those in C above. At both delay onset (left panel) and offset (right panel), changes in firing rate were larger during nosepoke events (both P < 0.05). E and F, data shown in C and D are regraphed as differences in the rate of change of firing, comparing movement and cue parameters. For each graph, values > 0 indicate higher values for movement parameters (nosepoke and movement onset) relative to cue parameters (cue onset and cue offset). Note that for all graphs shown in E and F, median values are positive, indicating higher rates of change in firing associated with movement parameters. G, for D+ neurons, delay onset responses occurred just prior to nosepoke onset (black bar), but significantly earlier relative to cue onset (grey bar) (left panel; P < 0.05). Delay offset responses occurred shortly after cue offset (grey bar) and movement initiation (black bar) (right panel; P > 0.05). Bars show median, 1st and 3rd quartile values of the time at which the change in firing occurred relative to the event of interest. H, for D− neurons, onset and offset responses (left and right panels, respectively) corresponded closely to nosepoke events, rather than cue onset/offset (P < 0.05 for both comparisons). Conventions are identical to those in E.