
Figure 7.
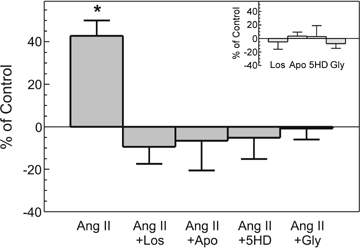
Superoxide production induced by 1 nmol l−1 Ang II (n = 34) in the absence and presence of 1 μmol l−1 losartan (Los, n = 8), 300 μmol l−1 apocynin (Apo, n = 7), 100 μmol l−1 5HD (n = 10) and 50 μmol l−1 glybenclamide (Gly, n = 6). Since superoxide production stabilized after 15 min (see Fig. 6), the data obtained at this time are expressed as a percentage of control values without additions. Inset shows the lack of effect of all drugs used upon the basal measurement. *P < 0.05 versus control.