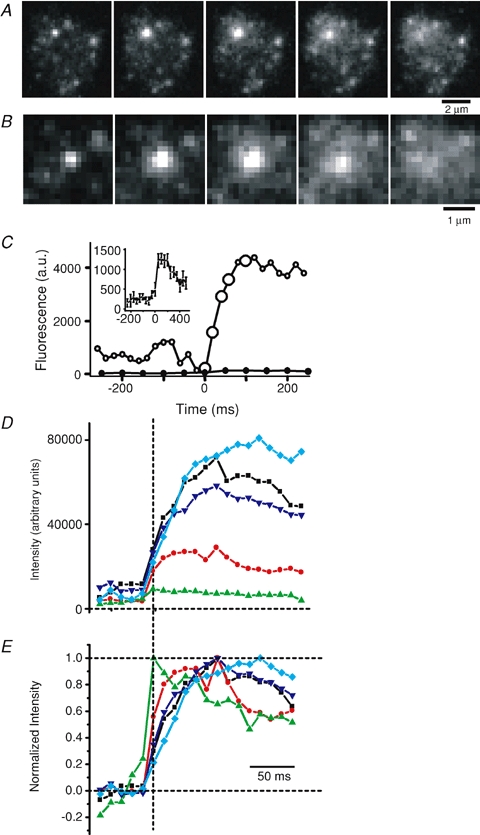
Figure 3.

Stimulated exocytosis of endosomes A, sequence of images during exocytosis of an endosome in a terminal subjected to strong labelling. B, images in A magnified. C, total fluorescence (○) of a 1.7 μm × 1.7 μm square placed over the centre of the exocytic site in A, after subtracting a background image (see Methods). Origin is assigned to the first frame before exocytosis. Filled circles represent a similar analysis on 20 fusing organelles labelled using the vesicle labelling protocol. Inset shows these data on an expanded ordinate. D, total fluorescence of a 2.5 μm × 2.5 μm square placed over the centre of five exocytic events imaged at 83.3 Hz, after subtracting a background image (see Methods). Dashed vertical line indicates the first frame of exocytosis. Note that fluorescence peaked many frames after the initiation of exocytosis for some fusing organelles. E, same data as in D, normalized so that the average fluorescence during the five frames immediately preceding exocytosis before exocytosis is 0 and the peak fluorescence is 1. Same colours and symbols in D and E indicate the same exocytic event.
