
Figure 4.
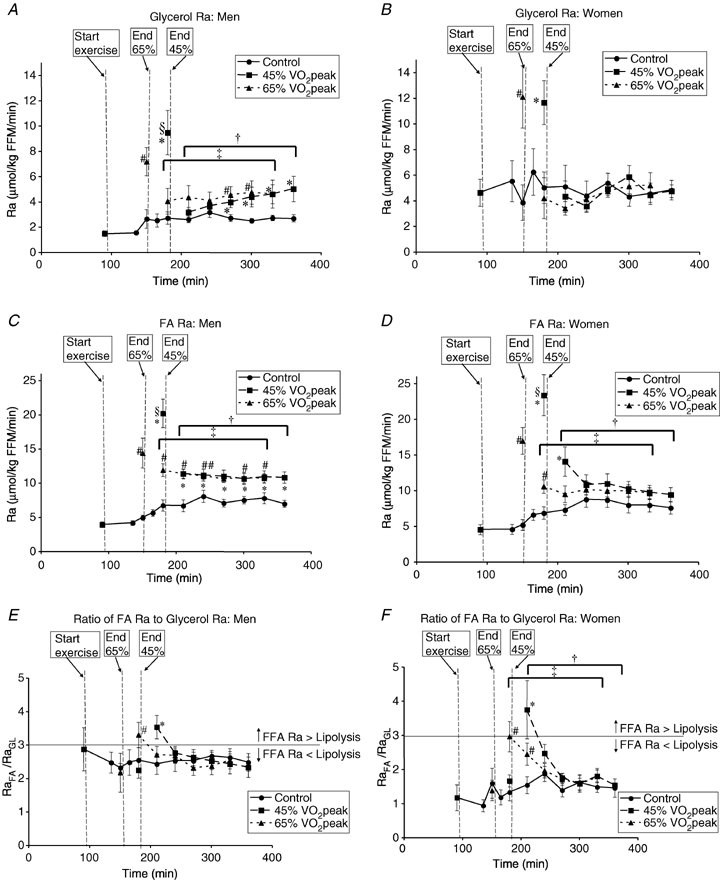
Metabolite kinetics A and B, glycerol Ra in men (A) and women (B). C and D, FA Ra in men (C) and women (D). E and F, ratio of glycerol Ra to FA Ra in men (E) and women (F). Values are means ±s.e.m. Men, n = 10; women, n = 8. Time (min), duration elapsed since beginning tracer infusion. Ra, rate of appearance. FFM, fat free mass. *45% trial significantly different from corresponding time points in Control trial, P < 0.05. #65%
 trial significantly different from corresponding time points in Control trial, P < 0.05. §45%
 trial significantly different from corresponding time points in 65%
 trial, P < 0.05. †Average postexercise (30 min to 180 min postexercise) in 45%
 trial significantly different from corresponding average in Control trial, P < 0.05. ‡Average postexercise (30 min to 180 min postexercise) in 65%
 trial significantly different from corresponding average in Control trial, P < 0.05.