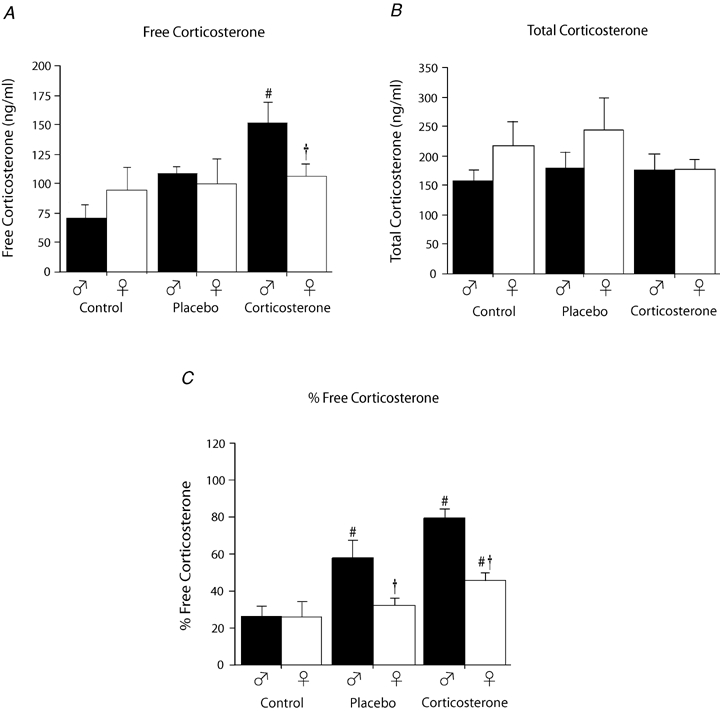
Figure 2.

Comparison of ‘resting’ free plasmatic corticosterone (A), total corticosterone (B) levels and the percentage of free corticosterone (C) between control, placebo and corticosterone treated rats Data were obtained in male (black) and female rats (white) 4 ± 1 days after ventilatory measurements were completed (i.e. 18 ± 1 day post surgery). A and B, data are expressed in ng ml−1; C, data are expressed as ratio (percentage). #Value different from the control condition (P < 0.05). †Value different from corresponding male value (P < 0.05).
