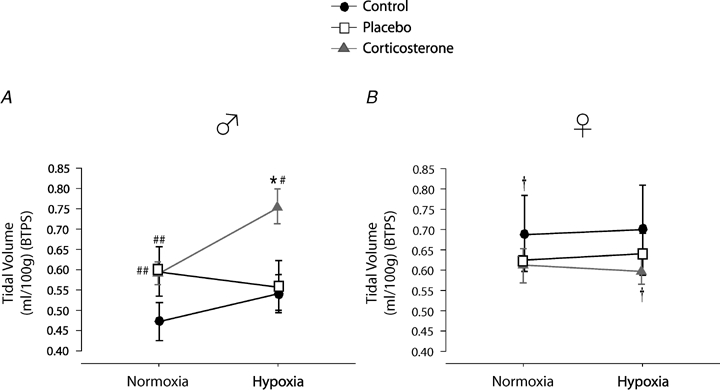
Figure 4.

Comparison of the tidal volume measurements obtained in control, placebo, and corticosterone treated male (A) and female rats (B) Data were obtained during normoxia (baseline) and following 20 min exposure to moderate hypoxia (12% O2). Data are expressed in ml 100 g−1 under BTPS conditions. *Value different from normoxia (P < 0.05). # and ## indicate values different from the corresponding control value at P < 0.05 and P < 0.1, respectively.
