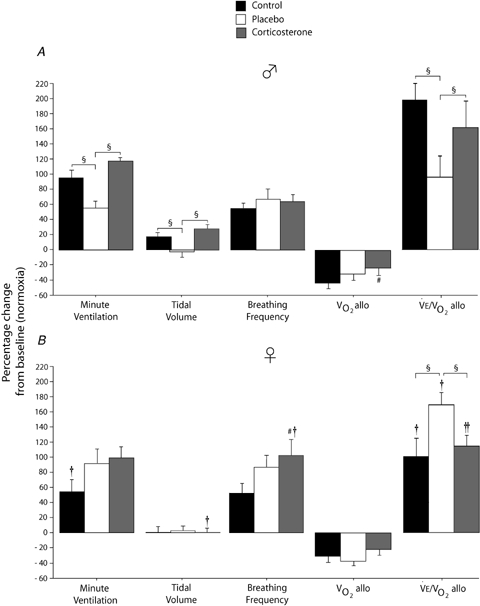
Figure 6.

Effects of experimental treatments (control, black bars), placebo implants (white bars), corticosterone implants (grey bar) on the ventilatory response to moderate hypoxia (12% O2; 20 min) Results for selected ventilatory variables expressed as a percentage change from normoxic values. Data were obtained in males (A) and females (B) and are expressed as means ± 1 s.e.m.§Values different at P < 0.05. #Value different from the control condition (P < 0.05). † and †† indicate values different from corresponding male value at P < 0.05 and P < 0.1, respectively.
