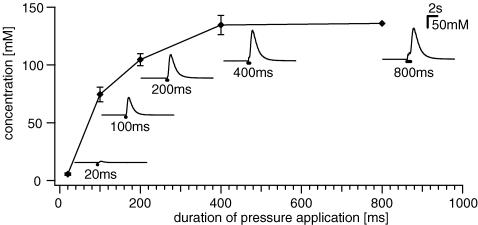
Figure 1. Drug dilution with pressure pulse microejection measured with a concentration element.
The duration of pressure ejection pulses of 1 m KCl (X-axis) is plotted against the calculated concentration of KCl (Y-axis) at the tip of the electrode. Insets illustrate representative traces of changes in KCl concentration for different pulse durations. Each data point represents 2–10 experiments. See Methods for further explanation.

