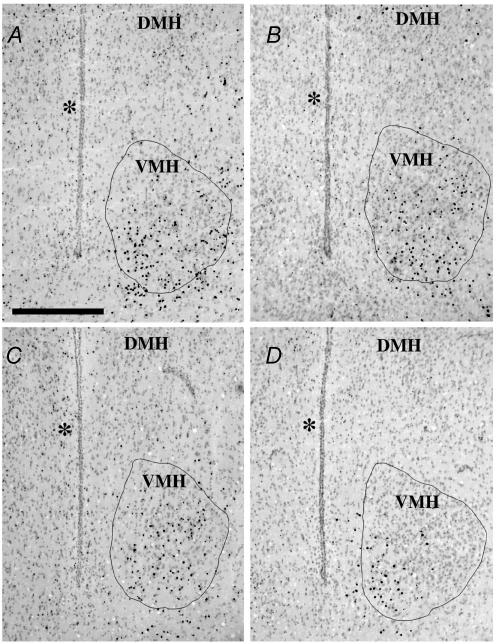
Figure 3. Coronal sections illustrating different expression of the Y1R/LacZ transgene in the rostral level of the ventromedial (VMH) nucleus of male mice from different experimental groups.
A, standard chow-fed male mouse; B, standard chow-fed male mouse treated for 3 days with 1 μg g−1 of murine recombinant leptin; C, MHF diet-fed male mouse; D, MHF diet-fed male mouse treated for 3 days with 1 μg g−1 of murine recombinant leptin. Pictures were digitized using a red filter to enhance the histochemical staining. The closed lines in each picture represent the area of interest (AOI) for counting the number of positive dots. The AOI was drawn following the boundaries of the ventromedial nucleus (VMH) on the green filter-digitized image. DMH, dorsomedial nucleus. * indicates third ventricle; scale bar, 400 μm.

