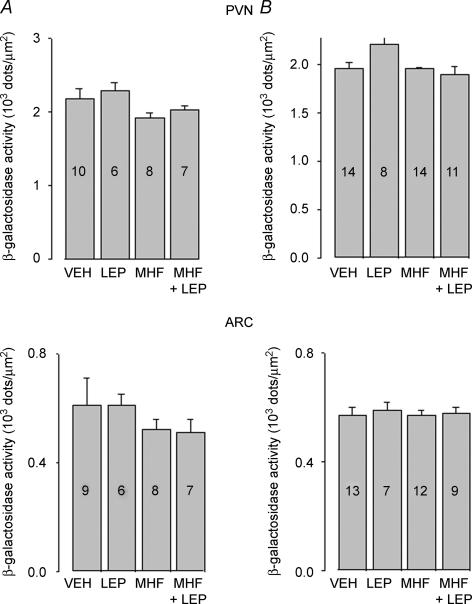
Figure 6. Effect of exposure to a MHF diet for 8 weeks on β-galactosidase in the paraventricular (PVN) (upper panel) and arcuate (ARC) (lower panel) of male (A) or female (B) Y1R/LacZ transgenic mice.
Mice were treated as in Fig. 5. Data are expressed as density of blue dots and are means ±s.e.m.; numbers within each column indicate the number of animals used for the determination. PVN, one-way ANOVA: A, F1,3 = 2.37, P = 0.0927; B, F1,3 = 2.207, P = 0.101. ARC, one-way ANOVA: A, F1,3 = 0.675, P = 0.575; B, F1,3 = 0.9114, P = 0.1768.

