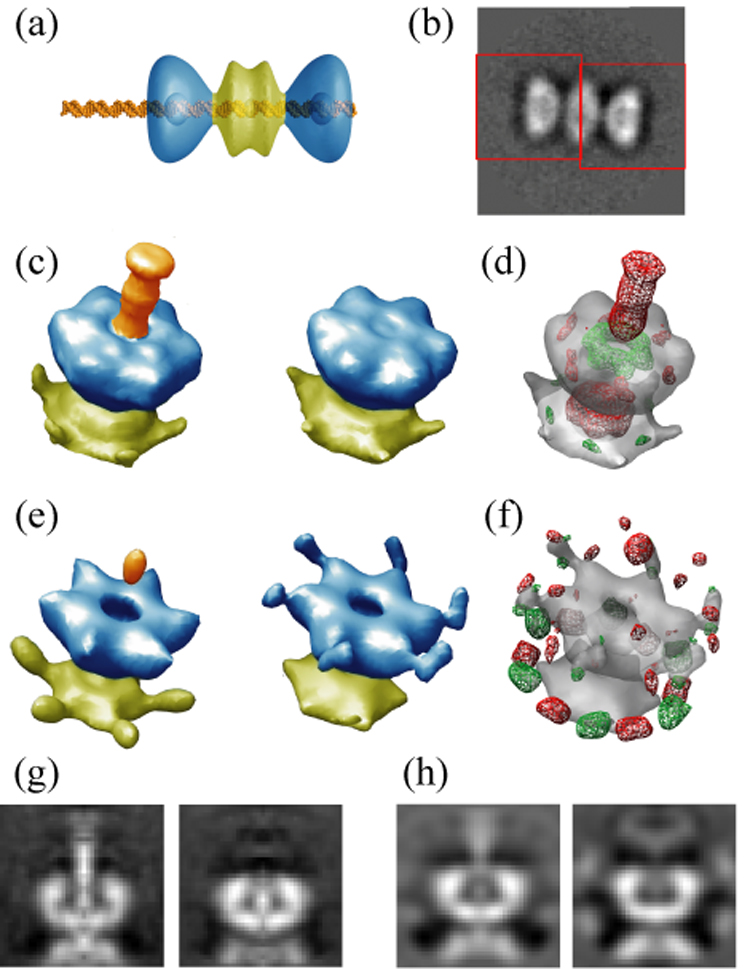
Figure 2. Application of MLF3D to large T-antigen C-terminal domains.

(a) Model representation for the complex between the LTA dodecamer and the asymmetric double stranded DNA probe. The C-terminal domains are coloured in blue, the N-terminal domains in yellow, and the DNA in orange. (b) Illustration of the windowing operations (40×40 pixels; red) based on a preliminary 2D alignment of the dodecamers. (c) Refined references as obtained with MLF3D, using the same colour code as in (a). (d) Difference map between the two references as obtained with MLF3D, with positive densities in red and negative differences in green, both contoured at three standard deviations of the difference map. (e–f) As in (c–d) but for the ML3D run. (g–h) Central slices through the maps shown in (c) and (e), respectively.
