
Figure 4. Application of MLF2D to synthetic test data.
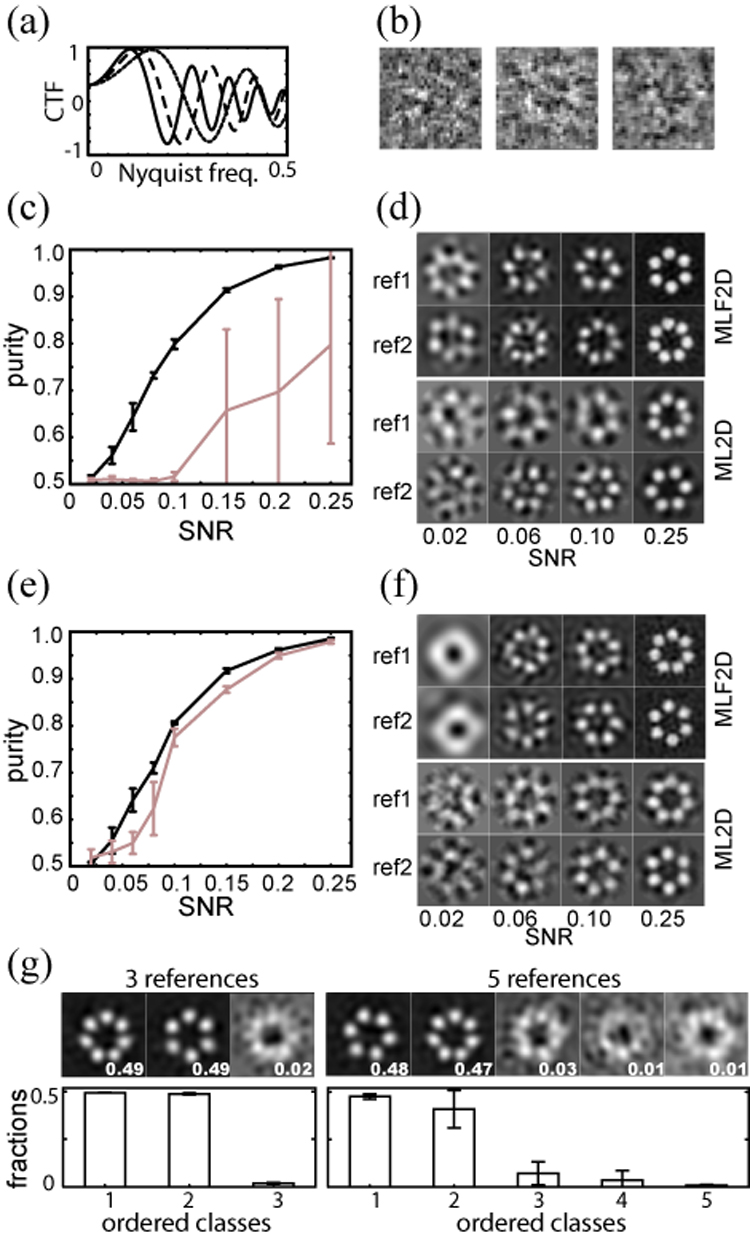
(a) The three CTFs that were applied to the test data, with defocus values of −1.5, −2.5 and −3.5 µm. (b) Examples of simulated images with a signal to noise ratio of 0.1 (one for each CTF). (c) Average and standard deviation for the class purities as obtained in five MLF2D (black) and five ML2D (grey) runs, using the complete set of 2×1,500 simulated particles with the three different CTFs at varying SNRs. The definition of class purity is as defined on p. 549 of (Tan et al., 2006). Note that purities range from 0.5 for random classifications to 1.0 for perfect classifications. (d) Corresponding refined references for the solution with the third best purity for MLF2D (top) and ML2D runs (bottom) with data at varying SNRs. (e) As (c), but only using the 2×500 simulated particles with the CTF as indicated with a dashed line in (a). (f) As (d), but for the runs presented in (e). (g) Bottom row: average and standard deviation for the relative class sizes (fraction of integrated probability weights), ordered from the largest to the smallest class for five independent runs with three (left) or five (right) references, using the data comprising all three CTFs and with a SNR of 0.15. Top row: the corresponding class averages for the run with the third highest sum of probability weights in two largest classes. The fraction of integrated probability weights for each class is indicated in the lower right corner of each reference.