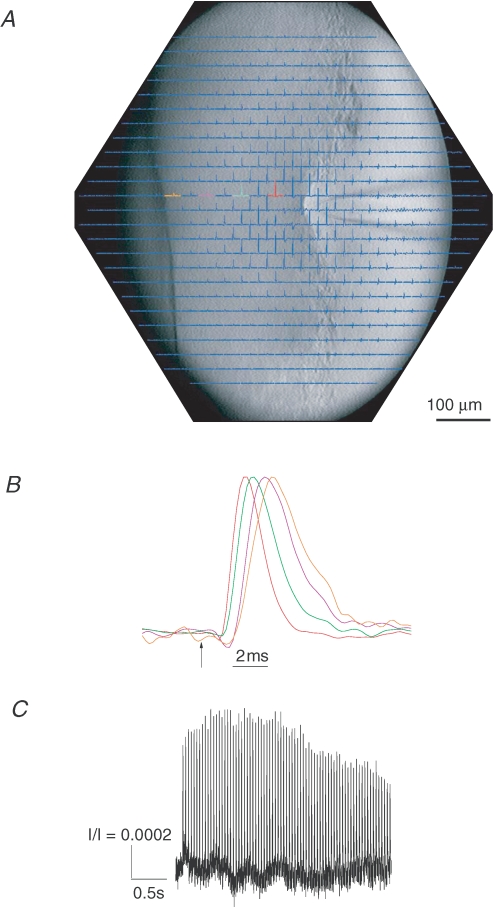
Figure 4. Propagation of action potentials through the posterior pituitary.
An array of photodiodes collected light over a 700 μm region of posterior pituitary. A, all 464 channels are displayed with the position of each signal corresponding to the site in a CCD image superimposed. Each trace is 100 ms in duration, with the stimulus applied 50 ms after the start. Each trace is an average of 4 trials at 3 s intervals. The distance between fields of adjacent diodes is 33 μm. The stimulating electrode is visible on the right and a nylon fibre that holds the preparation in place is visible on the left. Note that because of the increasing thickness of the tissue from right to left, the image is only in focus in one vertical stretch, and the left side appears darker. B, four traces from a series of locations were normalized and expanded in time to show the propagation of action potentials away from the site of stimulation. Colours of traces correspond to those in A. C, an optical response to a stimulus consisting of a single 3 s, 25 Hz train of pulses. This trace was a single trial from the location of the magenta trace in Fig. 4A, which is ∼200 μm from the stimulating electrode.

