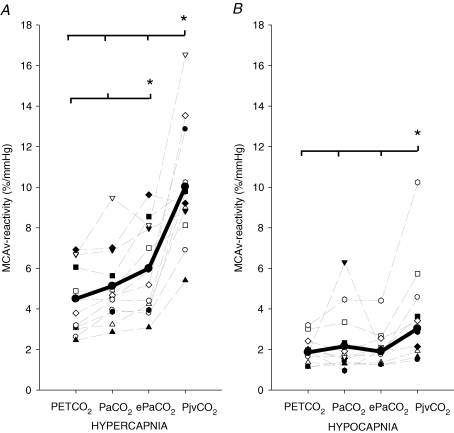
Figure 3. Calculation of cerebrovascular CO2 reactivity usingPET,CO2, Pa,CO2, ePa,CO2andPjv,CO2during hypercapnia (A) and hypocapnia (B).
Each faint line represents an individual reactivity. Bold lines represent group average. Note: Pjv,CO2–MCAv reactivity was higher during both hypercapnia (∼97%, A) and hypocapnia (∼24%, B) when compared with Pa,CO2–MCAv reactivity. There seemed to be three visual outliers in both A and B; however, upon closer examination, these data points are within 2 s.d. of the sample mean and therefore not classed as statistical outliers. Further, these data points do not reflect any non-compliance or technical error, and all other data (i.e. heart rate, MCAv, BP, end-tidal CO2) were normal during each test.

