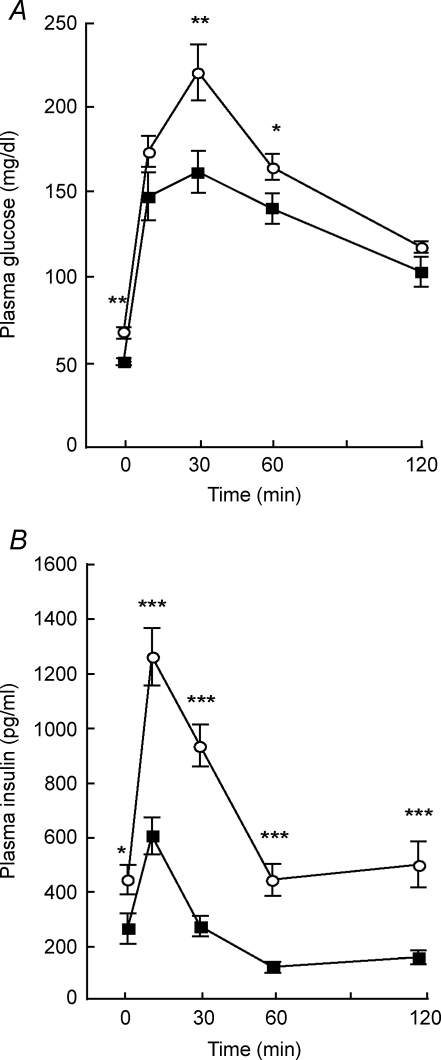
Figure 1. Intraperitoneal glucose tolerance test (GTT) for V1bR−/− mice.
Plasma glucose (A) and insulin levels (B) during GTT in V1bR+/+ (○) and V1bR−/− (▪) mice (n= 16 of each). Values are the means ± S.E.M. *P < 0.05, **P < 0.01 and ***P < 0.001 versus V1bR+/+ mice by post hoc comparison with Fisher's PLSD.

