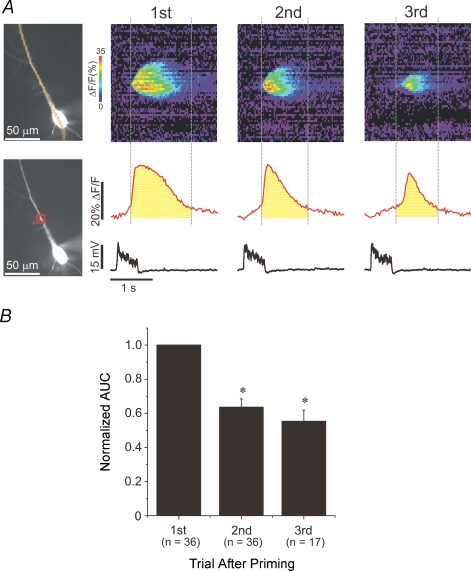
Figure 3. The effect of priming declines over successive trials.
A, the fluorescence change of three successive trials following priming in a representative cell. The region used to calculate the area under the curve (AUC) in the red ROI is indicated under each curve. The areas were calculated between the times when the waves began and an estimate of the times when they ended. B, histogram of the AUCs of the first three successive trials following priming for those cells where release occurred for three or more trials. The AUC values of the 2nd and 3rd trials were normalized to the AUC value of the first trial. The values of the AUC of the second and third trials were significantly lower compared to the first trials. (One-way ANOVA, F= 34.5, P≤ 0.05.)

