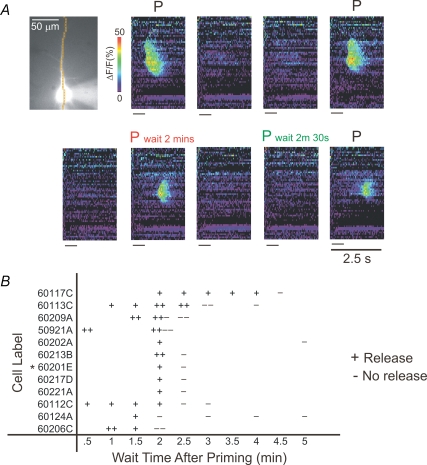
Figure 8. The effect of priming lasts for about 2–3 min.
A, example of a cell in which the effect of priming lasted for 2 min. Ca2+ release was synaptically evoked with stimulation of 35 μA current (50 pulses at 10 ms intervals) without priming (no label above the pseudocolour image), immediately after priming for 15 s at 4 Hz (black P), waiting 2 min after priming for 15 s at 4 Hz (red P), or waiting 2 min 30 s after priming for 15 s at 4 Hz (green P). Release was present when the cell was stimulated 2 min after priming but absent when stimulated 2 min 30 s after priming. The absence of release was not a result of a rundown of the cell because in the subsequent trial release was again detected when stimulated immediately after priming. B, scatter plot of the results of all release trials in individual cells tested with different delays following priming. ‘+’ represents a successful release trial and ‘−’ represents a failure. The * is next to the cell shown in A. The majority of +'s lie to the left of the 3 min mark.

