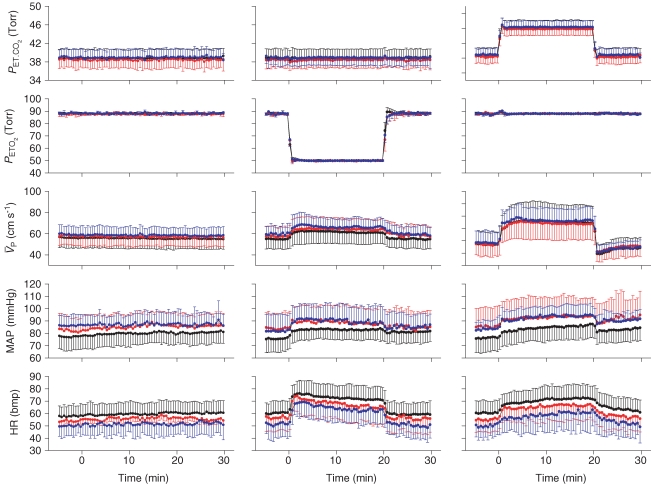
Figure 2. Ensemble-averages of the time-related changes in end-tidalPCO2 (PET,CO2) and PO2 (PET,O2), and the responses of middle cerebral artery blood velocity ( ), blood pressure (MAP) and heart rate (HR) to hypoxia and hypercapnia.
Profiles represent group averages (n= 10 subjects) for control (black), l-NMMA (red), and phenylephrine (blue) days. Left panel (isocapnic euoxic), middle panel (isocapnic hypoxia), right panel (euoxic hypercapnia). Each symbol and error bar represents a 15 s mean ±s.d.

