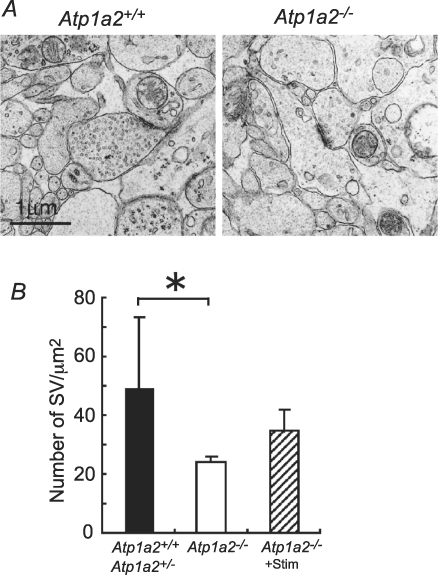
Figure 11. Electron micrographs of single synapses in the ventrolateral medulla of Atp1a2+/+ or Atp1a2+/− and Atp1a2−/− mice.
A, representative examples of presynaptic terminals with normal gross structural Atp1a2+/+ and Atp1a2−/− features. Note the presence of fewer synaptic vesicles in the presynaptic region in Atp1a2−/− mice. B, quantitative analysis of synaptic vesicles (SV). Number of vesicles per μm2 of presynaptic region of embryonic day 18.0–18.5 Atp1a2+/+ or Atp1a2+/− (n= 4) and Atp1a2−/− (n= 4) fetuses. Atp1a2−/−+ stim (n= 3) received repeated stimulation with 100 nm substance P. Data are means ±s.e.m.*P < 0.04.

