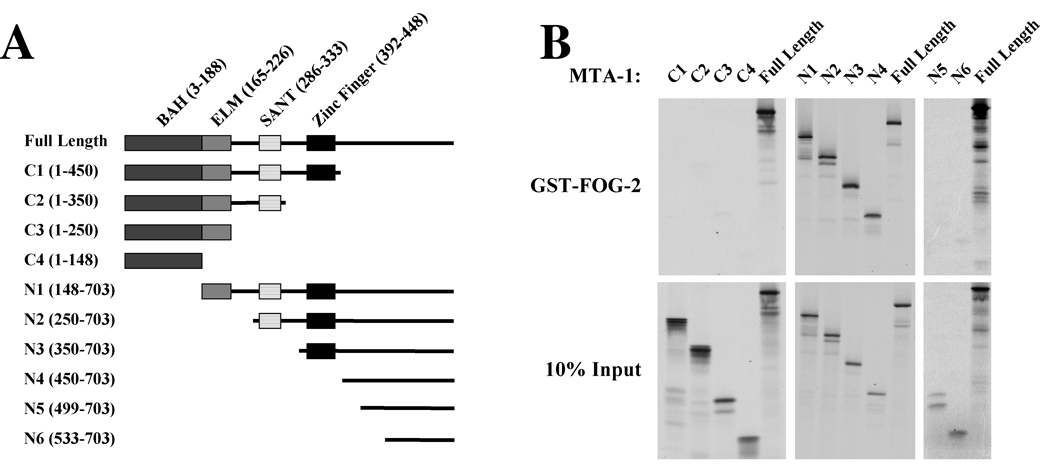
Figure 3. The C-terminal Portion of MTA-1 Interacts with FOG-2.
A. A schematic of the known protein domains of MTA-1 and N- and C-terminal truncations of MTA-1 used in the binding assays. B. In vitro binding assays between GST-FOG-2(1–12) and N- and C-terminal truncations of MTA1. The binding assays were performed as described in Figure 2. The top panels show the results with GST-Fog-2(1–12) fusion protein and the truncation indicated above. The bottom panels show the input MTA truncations.

