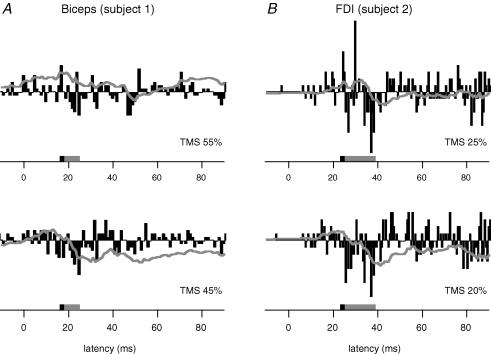
Figure 2. Typical data for a single motor unit in biceps and first dorsal interosseus (FDI).
Difference histograms to show the response to two levels of very low-intensity TMS in a motor unit from biceps (A, n= 400 triggers) and FDI (B, n= 200 triggers). Cortical stimulation was delivered at time zero. The time of the suppression is indicated by the grey box in each histogram and the time-window for the facilitation seen at high-intensity TMS (not illustrated) is indicated by a black box. The grey line indicates the cumulative sum for the difference histogram. At both intensities of stimulation there is a suppression of firing of the motor unit.

