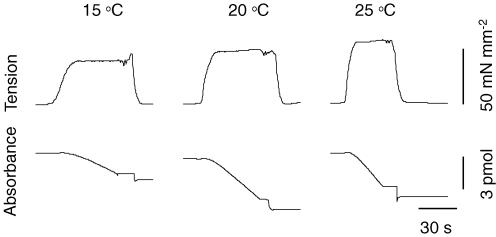
Figure 1. Original recordings of isometric tension development (top) and NADH absorbance (bottom) at the experimental temperatures indicated.
Upon incubation of the preparation into activating solution containing a saturating Ca2+ concentration, tension started to increase until a steady level was reached. During this phase, NADH absorbance started to decline; its final slope reflects the rate of ATP hydrolysis. During the final period of steady activation, stirring of the solution was stopped to reduce noise in the force signal during the measurement of ktr. After transfer of the preparation back into the relaxing solution, tension and NADH consumption returned to the baseline levels.

