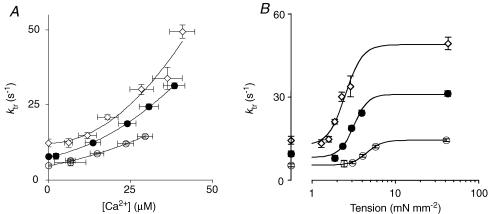
Figure 4. Temperature dependence of the ktr–[Ca2+] relationship (A) and the ktr–tension relationship (B).
In A, the relationship between tension and ktr was curvilinear at all three temperatures; exponential fits of these data allowed for the determination of an extrapolated value of ktr at zero tension (ktr−min); this parameter is indicated on the y-axis in B. ^, 15°C; •, 20°C; ⋄, 25°C.

